Tsunamiformel
Bildinfo und Lizenz
© 2016
- 2026
Basiswissen|
Kurzinfo|
Wie sieht die Formel aus?|
Legende|
Was setzt man in die Formel ein?|
Zahlenbeispiel|
Wie rechnet man in km/h um?|
Was sind normale Wassertiefen?|
Was verändert sich bei Tsunamis noch?|
Was waren berühmte Tsunamis?
Bildinfo
- Man sieht eine kolorierte Karte des Atlantiks mit angrenzenden Küstengebieten.
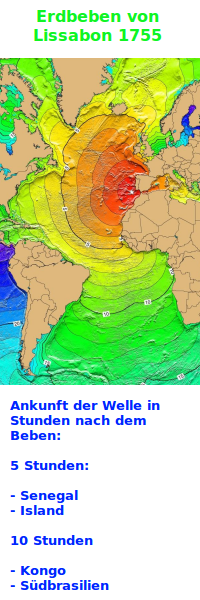
- Travel times of the tsunami from the 1755 Lisbon earthquake, calculated with the Tsunami Travel Times (TTT) software. Red contours are for 1-4 hour arrival times, yellow (5-6 hrs.), green (7-14 hrs.), and blue (15-21 hrs.). NOTE: These maps do not provide information on the height or the strength of the wave
Source
- Created: Probably around the year 2009
- Author: NOAA's National Geophysical Data Center (NGDC)
License
- This image is in the public domain because it contains materials that originally came from the U.S. National Oceanic and Atmospheric Administration, taken or made as part of an employee's official duties.
Warranty
- No guarantee can be given as to the correctness of facts implied or explicitly stated.
- Usage is completey at your own risk. 💣
Originalseite
- Das Bild ist Teil eines online-Lexikons.
- Rhetos Lernlexikon Mathematik, Aachen:
- Siehe unter 👉 Tsunamiformel